[TOC]
Grafana模板:10280
一、Prometheus监控SpringBoot#
1.1 pom.xml添加依赖#
 1
 2
 3
 4
 5
 6
 7
 8
 9
10
11
12
13
14
15
16
17
18
19
20
| <dependencies>
<dependency>
<groupId>org.springframework.boot</groupId>
<artifactId>spring-boot-starter-actuator</artifactId>
</dependency>
<dependency>
<groupId>org.springframework.boot</groupId>
<artifactId>spring-boot-starter-web</artifactId>
</dependency>
<dependency>
<groupId>org.springframework.boot</groupId>
<artifactId>spring-boot-starter-test</artifactId>
<scope>test</scope>
</dependency>
<dependency>
<groupId>io.micrometer</groupId>
<artifactId>micrometer-registry-prometheus</artifactId>
<version>1.1.3</version>
</dependency>
</dependencies>
|
1.2 修改application.yml配置文件#
 1
 2
 3
 4
 5
 6
 7
 8
 9
10
11
12
13
14
15
16
17
18
19
20
21
22
23
24
25
26
27
28
29
30
31
32
33
34
35
36
37
| server:
port: 8002 # 配置启动端口号
spring:
application:
name: mydemo
metrics:
servo:
enabled: false
management:
endpoints:
web:
exposure:
include: info, health, beans, env, metrics, mappings, scheduledtasks, sessions, threaddump, docs, logfile, jolokia,prometheus
base-path: /actuator #默认/actuator 不更改可不用配置
#CORS跨域支持
cors:
allowed-origins: http://example.com
allowed-methods: GET,PUT,POST,DELETE
prometheus:
id: springmetrics
endpoint:
beans:
cache:
time-to-live: 10s #端点缓存响应的时间量
health:
show-details: always #详细信息显示给所有用户
server:
port: 8001 #默认8080
address: 127.0.0.1 #配置此项表示不允许远程连接
#监测
metrics:
export:
datadog:
application-key: ${spring.application.name}
web:
server:
auto-time-requests: false
|
这里涉及两个port,一个是server port,一个是prometheus port,其中server port则是调用接口使用的端口,而prometheus port则与该服务在prometheus.yml中的port是一致的,不一致的话则会使该服务down。
1.3 设置启动类Application#
 1
 2
 3
 4
 5
 6
 7
 8
 9
10
11
12
| @SpringBootApplication
public class Springboot2PrometheusApplication {
public static void main(String[] args) {
SpringApplication.run(Springboot2PrometheusApplication.class, args);
}
@Bean
MeterRegistryCustomizer<MeterRegistry> configurer(
@Value("${spring.application.name}") String applicationName) {
return (registry) -> registry.config().commonTags("application", applicationName);
}
}
|
开启 actuator 后要注意要防护,请勿将开启 actuator 的服务直接对外。如果你需要这么做,可以新增一个过滤器对 /actuator 进行过滤,只允许内网IP地址访问。
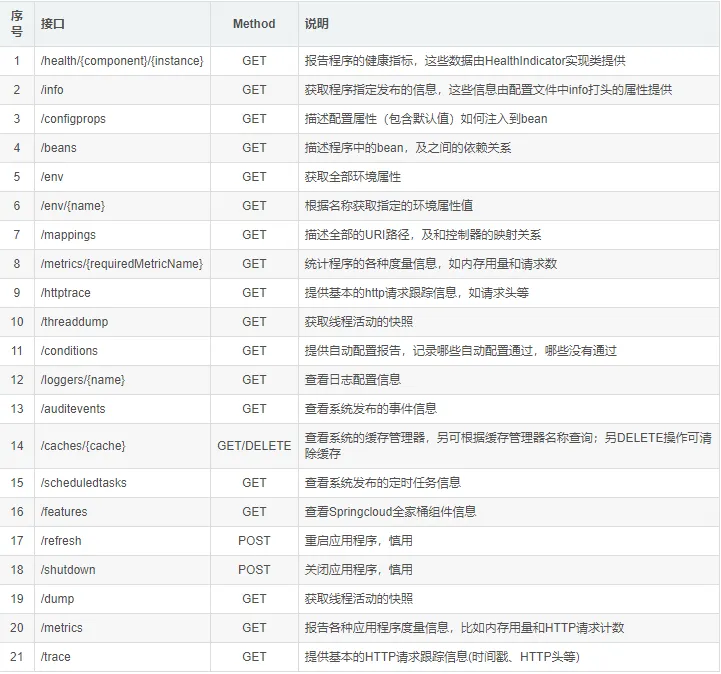
SpringBoot项目到这里就配置完成了,启动项目,访问http://localhost:8080/actuator/prometheus,如图所示,可以看到一些度量指标。

包含但不限于以下接口都是在开启 actuator 之后可以访问的(默认统一前缀 /actuator):
1.4 Prometheus配置#
 1
 2
 3
 4
 5
 6
 7
 8
 9
10
11
12
13
14
15
16
17
18
19
20
21
22
23
24
25
26
27
28
29
30
| # my global config
global:
scrape_interval: 15s # Set the scrape interval to every 15 seconds. Default is every 1 minute.
evaluation_interval: 15s # Evaluate rules every 15 seconds. The default is every 1 minute.
# scrape_timeout is set to the global default (10s).
# Alertmanager configuration
alerting:
alertmanagers:
- static_configs:
- targets:
# - alertmanager:9093
# Load rules once and periodically evaluate them according to the global 'evaluation_interval'.
rule_files:
# - "first_rules.yml"
# - "second_rules.yml"
# A scrape configuration containing exactly one endpoint to scrape:
# Here it's Prometheus itself.
scrape_configs:
- job_name: 'prometheus'
static_configs:
- targets: ['127.0.0.1:9090']
###以下内容为SpringBoot应用配置
- job_name: 'springboot_prometheus'
scrape_interval: 5s
metrics_path: '/actuator/prometheus'
static_configs:
- targets: ['127.0.0.1:8080']
|
二、Rest接口的编写#
编写了一个接口,接口是http rest风格的add接口,具体代码如下所示:
 1
 2
 3
 4
 5
 6
 7
 8
 9
10
11
12
13
14
15
16
17
18
19
20
21
22
23
24
25
26
27
28
29
30
| import io.micrometer.core.instrument.Counter;
import io.micrometer.core.instrument.MeterRegistry;
import org.springframework.beans.factory.annotation.Autowired;
import org.springframework.validation.annotation.Validated;
import org.springframework.web.bind.annotation.*;
import javax.annotation.PostConstruct;
@RestController
@RequestMapping("/api")
public class OperationController {
@Autowired
MeterRegistry registry;
private Counter counter;
private Counter failCounter;
@PostConstruct
private void init(){
failCounter= registry.counter("requests_add_fail_total","save","carson");
counter = registry.counter("requests_add_total","save","carson");
}
@RequestMapping(value = "/add",method = RequestMethod.POST)
public String add(@Validated String firstName,@Validated String secondName) throws Exception {
try{
String name = firstName+secondName;
counter.increment();
return name;
}catch (Exception e){
failCounter.increment();
throw new Exception("异常");
}
}
}
|
其中init方法则是对prometheus中counter组件进行初始化,而在add接口中则可以直接使用,这里两个指标分别为调用成功的次数与调用失败的次数。
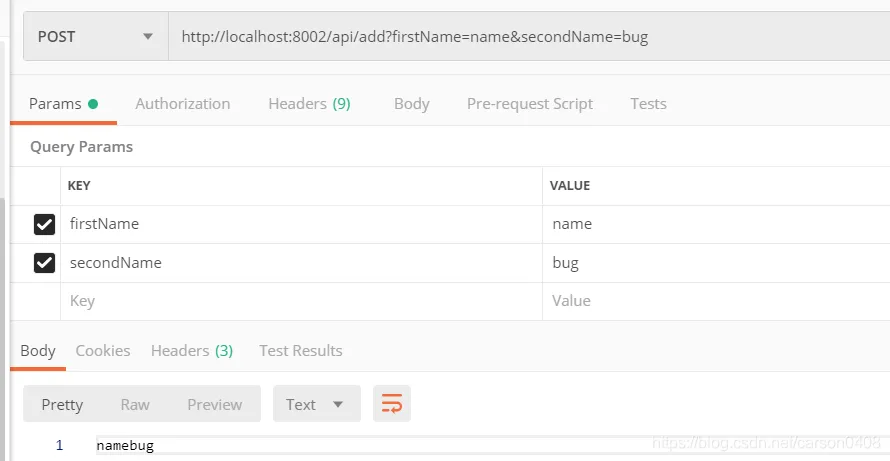
2.1 模拟调用#
通过postman进行调用接口,如下图所示:
2.2 Grafana监控视图的制作#
在grafana页面新增dashboard之后,便进入下图所示:
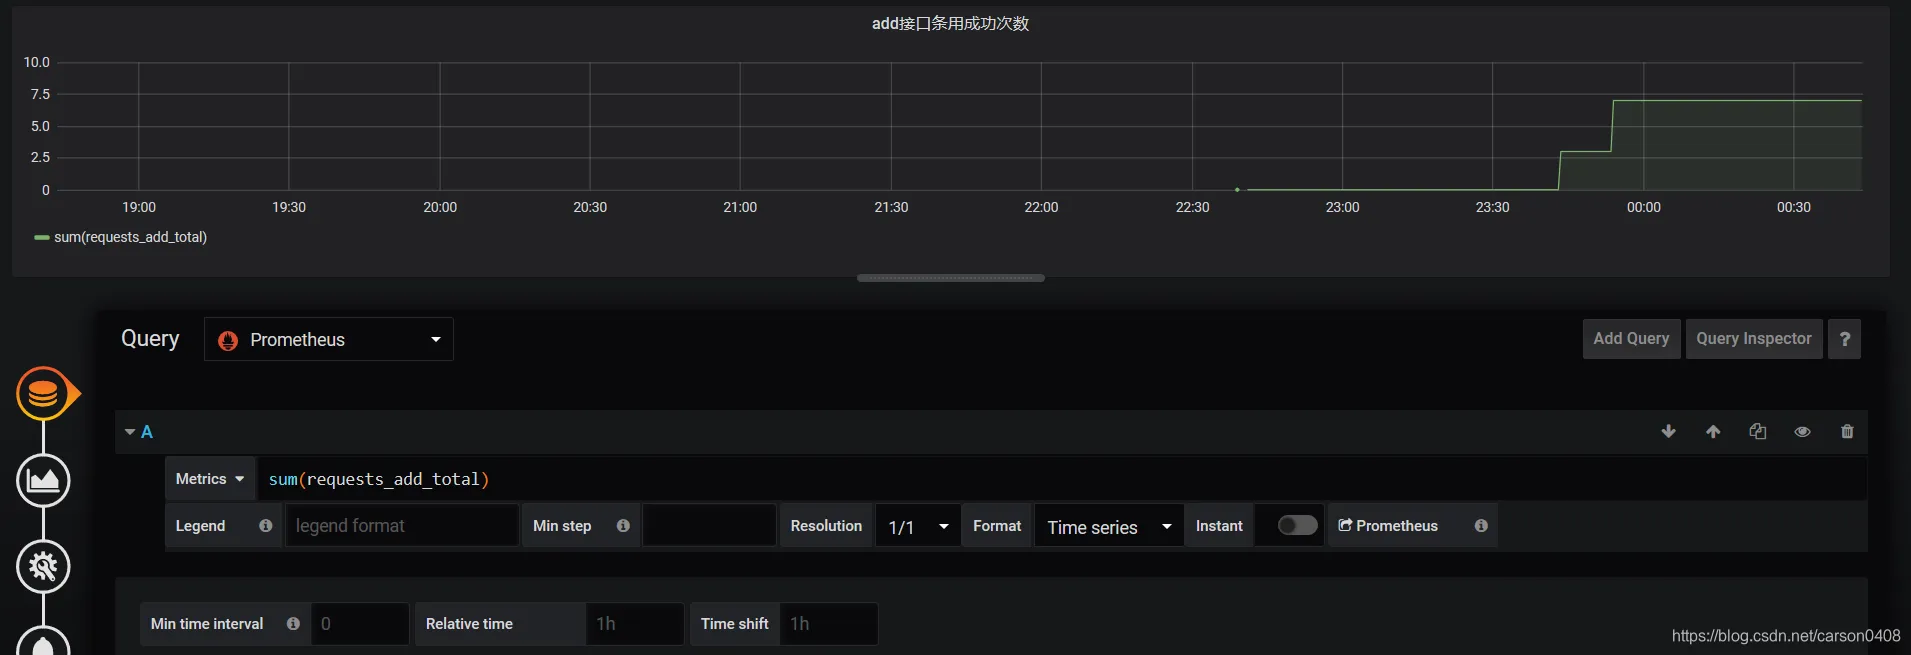
 然后选中数据源,并进行metrics语句编写,如下图所示,sum(request_add_total) ,其中sum函数中的字段可以模糊搜索,只要prometheus中的服务是up的。然后图就如下所示,可以看出,调用情况:
三、SpringBoot应用实现案例#
3.1 在pom文件添加#
1
2
3
4
5
6
7
8
| <dependency>
<groupId>io.micrometer</groupId>
<artifactId>micrometer-registry-prometheus</artifactId>
</dependency>
<dependency>
<groupId>org.springframework.boot</groupId>
<artifactId>spring-boot-starter-actuator</artifactId>
</dependency>
|
3.2 在代码中添加如下配置:#
 1
 2
 3
 4
 5
 6
 7
 8
 9
10
11
12
13
| private Counter requestErrorCount;
private final MeterRegistry registry;
@Autowired
public PrometheusCustomMonitor(MeterRegistry registry) {
this.registry = registry;
}
@PostConstruct
private void init() {
requestErrorCount = registry.counter("requests_error_total", "status", "error");
}
public Counter getRequestErrorCount() {
return requestErrorCount;
}
|
3.3 在异常处理中添加如下记录:#
1
| monitor.getRequestErrorCount().increment();
|
3.4 在prometheus的配置中添加springboot应用服务监控#
1
2
3
4
5
| - job_name: 'springboot'
metrics_path: '/actuator/prometheus'
scrape_interval: 5s
static_configs:
- targets: ['192.168.8.45:8080']
|
3.5 Prometheu.yml配置如下:#
1
2
3
4
5
| - job_name: 'springboot'
metrics_path: '/actuator/prometheus'
scrape_interval: 5s
static_configs:
- targets: ['192.168.8.45:8080']
|
规则文件配置如下:

3.6 在prometheus监控即可查看#
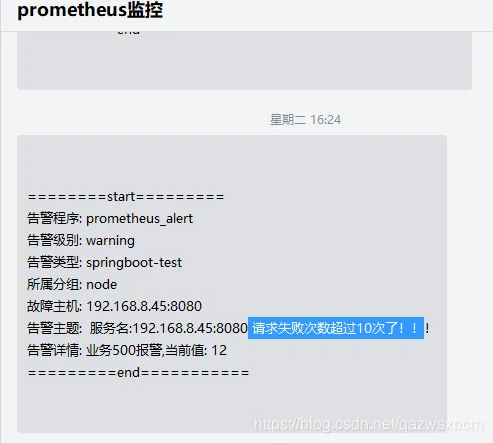
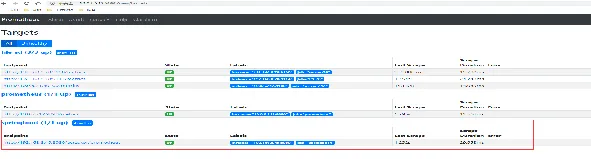 企业微信告警效果图: